Valuer Insights
Business Insights | Hong Kong’s 2026/27 Valuation List: Movements, Insights and Implications
May 4, 2026

Contact

Overview
The Rating and Valuation Department (RVD) has recently published the Valuation List and Government Rent Roll for Rate Year 2026/27. The list comprises 2,768,855 assessments, representing a modest year-on-year (YoY) increase of 1.5%. Aggregate rateable value (RV) of all asset classes territory wide rose to HK$759.2 billion, an increase of 1.9% from the previous rate year (see Chart 1). This growth in RV is notably milder than the uplift recorded in Rate Year 2025/26 (+4.8% YoY), signalling a moderate and stabilising market recovery.By geographic distribution, the New Territories continue to account for the largest share of total RV at approximately 41.2%, followed by Hong Kong Island and Kowloon, each at around 29.4%.
RV movements indicate uneven regional performance. Kowloon recorded the strongest growth, with RV increasing by 2.7% YoY. This outperformance reflects a combination of district-level residential strength, completion of infrastructure projects, and a lower base effect from the previous year. The New Territories recorded a solid increase of 2.4%, broadly in line with overall market improvement. In contrast, Hong Kong Island lagged behind, with RV rising by only 0.6%. This comparatively modest growth highlights weaker overall momentum on the Hong Kong Island, despite pockets of strength such as the Southern district, where new luxury residential supply supported rental growth.
Chart 1. Aggregate RV and YoY % from 2020/21 to 2026/27
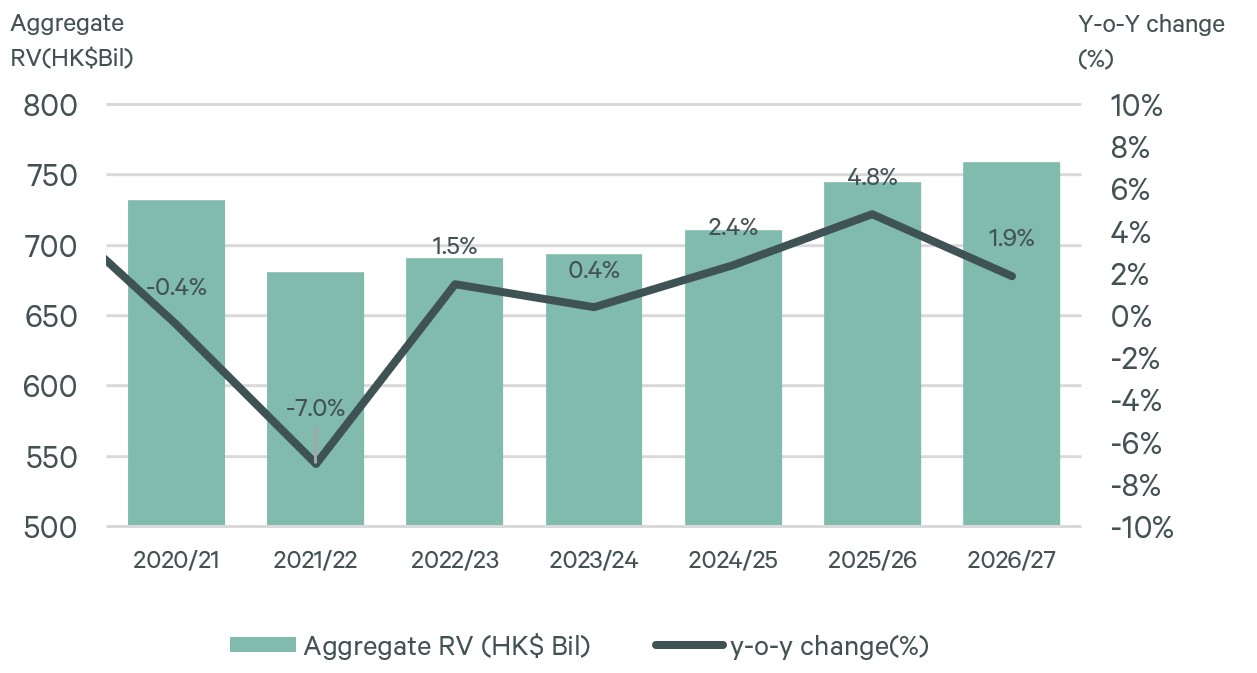
Source: Rating & Valuation Department, CBRE VAS
Private Domestic Sector – Key Driver of RV Growth
The valuation results highlight a clear divergence across asset classes (see Chart 2). Private domestic properties recorded an increase in RV, while most non-domestic sectors—particularly office and industrial/office premises—continue to adjust downward amid softer leasing demand.Chart 2. YoY % change in Aggregate RV by asset classes (2026/27 vs prior year)
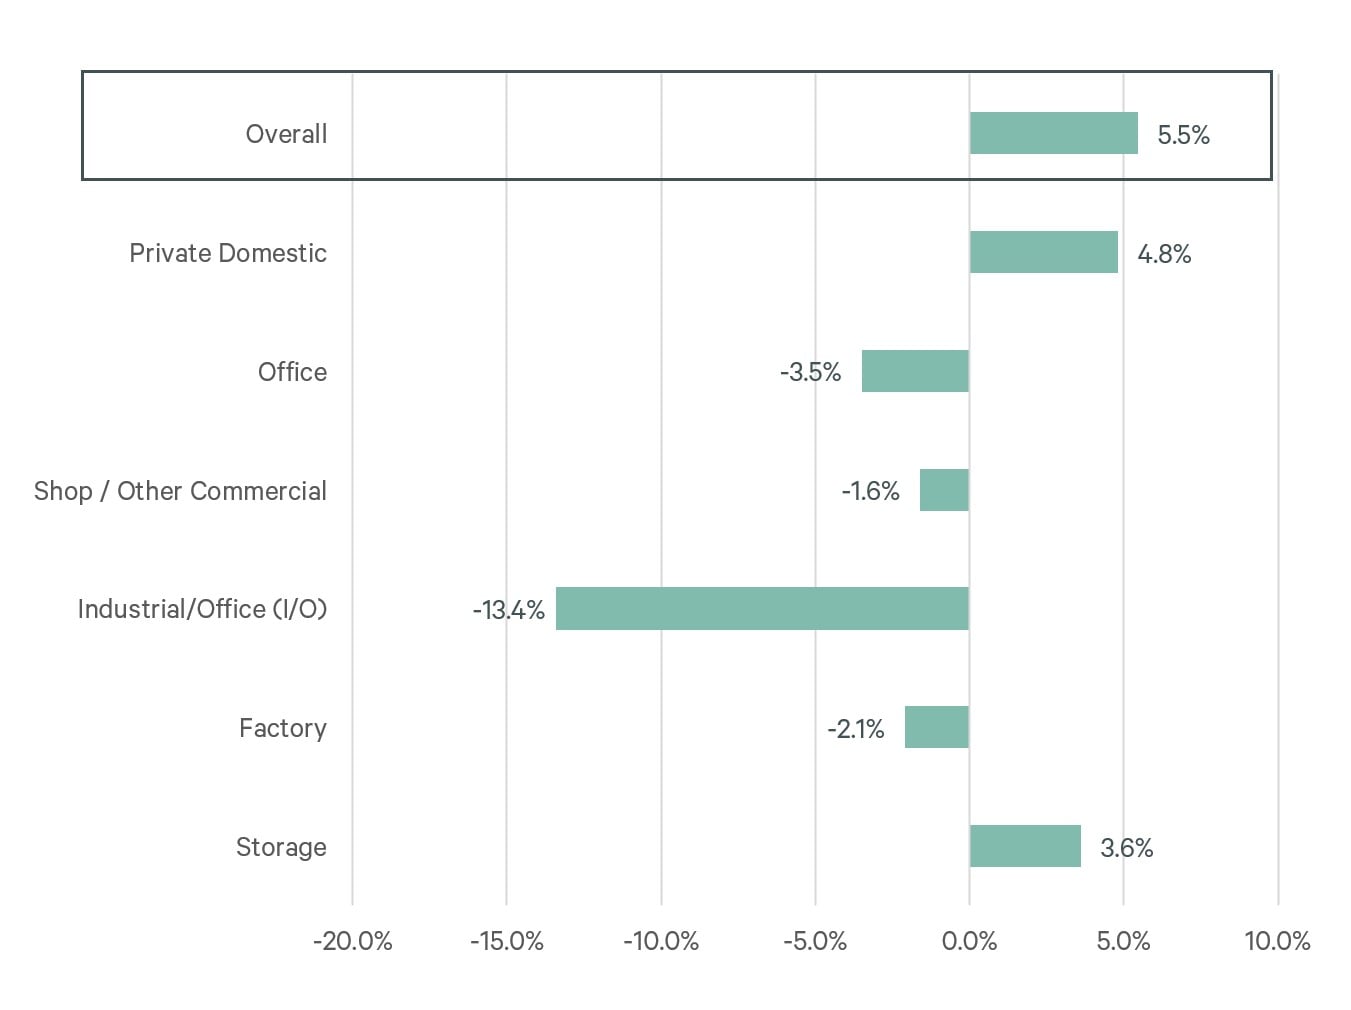
Source: Rating & Valuation Department, CBRE VAS
Private domestic was the major asset class recording an increase in RV, apart from Storage, and continue to be the primary driver of overall valuation growth. The number of private domestic assessments increased by approximately 1.6% to just over 2.03 million units, while aggregate private domestic RV rose by 4.8%.
This increase reflects strong underlying demand, improved market sentiment, and structural demand drivers including the inflow of talent and students, which supported leasing activity during the valuation reference period. Demand has been particularly resilient in well‑located estates with strong transport connections and comprehensive amenities, including areas benefiting from student accommodation demand. At the same time, new residential supply in infrastructure‑supported districts has generally been absorbed efficiently, allowing rental benchmarks to edge higher. Improving market sentiment, and stabilising interest rates enabled landlords to maintain firmer rental expectations and supporting continued incremental increases in residential RV.
In terms of growth momentum, Kowloon recorded the strongest y-o-y private domestic RV increase (+6.7%), outperforming both the New Territories (+4.8%) and Hong Kong Island (+3.1%). The New Territories recorded growth at a broadly similar overall level, while Hong Kong Island lagged behind the city-wide average (see Chart 3).
Kowloon’s stronger performance is also partly attributable to a lower base effect in the prior year, amplifying the y-o-y growth rate in the current valuation cycle.
Chart 3. Private Domestic Rateable Value % Change (2026/27 vs prior year)
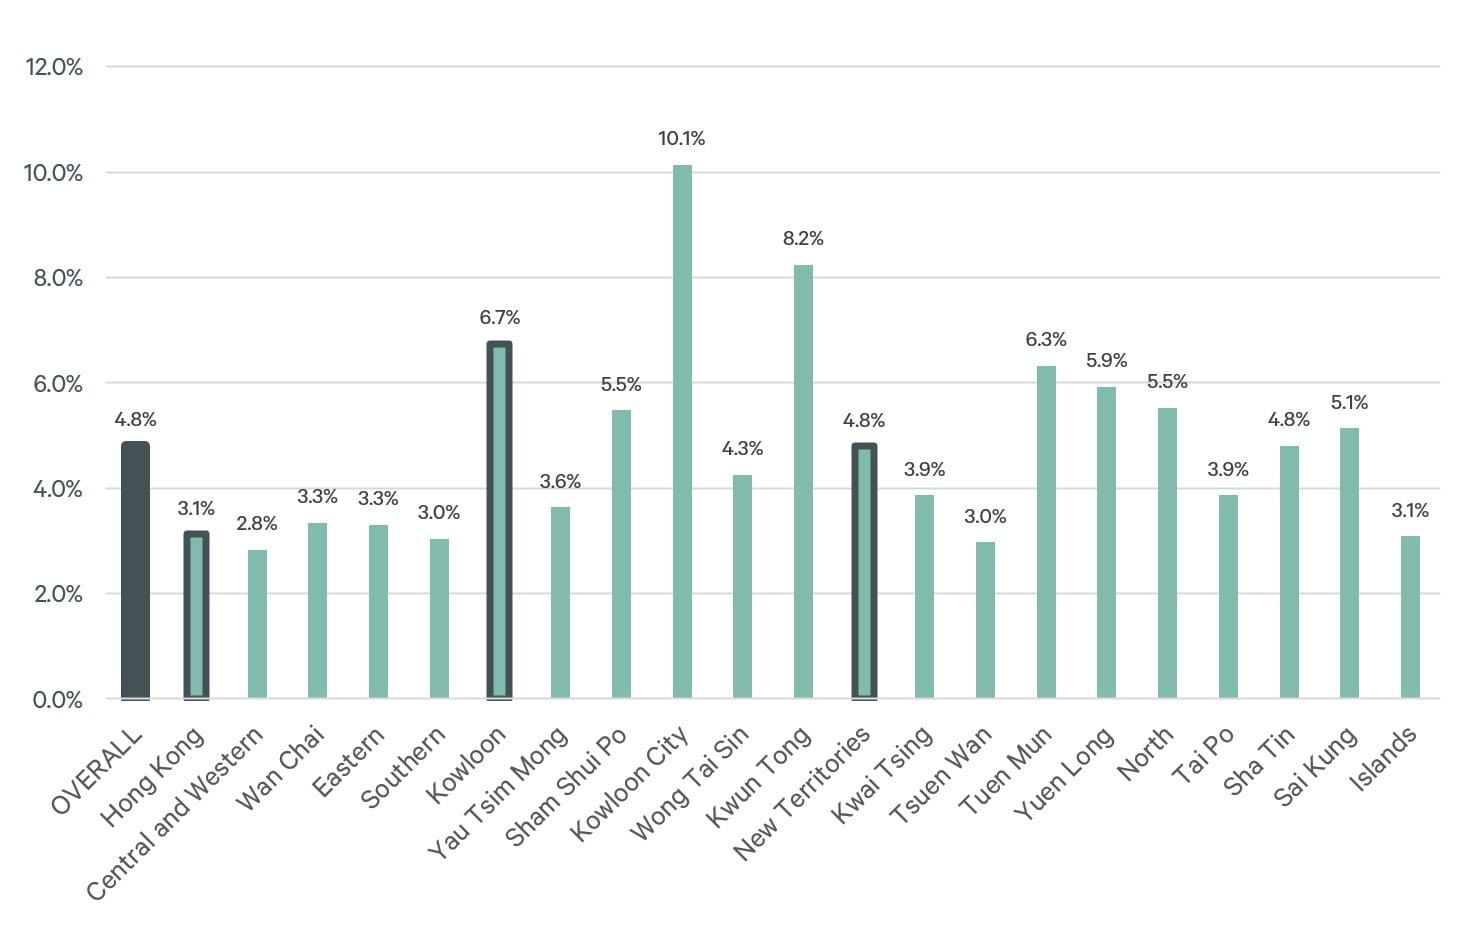
Source: Rating & Valuation Department, CBRE VAS
Private Domestic – District-Level Performance
Kowloon City and Kwun Tong emerged as the key growth drivers within Kowloon, with residential RV increasing by 10.1% and 8.2%, respectively. The strong uplift reflects the combined impact of major infrastructure completion, new residential developments, and enhanced district amenity offerings, which collectively improved rental attractiveness during the valuation reference period.
In Kowloon City, growth has been significantly underpinned by the transformation of the Kai Tak area. The completion and commissioning of Kai Tak Sports Park, together with surrounding commercial, leisure and waterfront facilities, has materially enhanced the liveability and profile of the district. Improved connectivity via the MTR network, including proximity to Kai Tak and Sung Wong Toi stations, has further strengthened accessibility. These factors, alongside the steady intake of new residential supply in and around the Kai Tak Development Area, have supported stronger rental demand and contributed to the notable rise in residential RV.
Meanwhile, Kwun Tong’s residential RV growth has been driven by ongoing urban regeneration and the introduction of new private residential developments, most notably KOKO Hills and other projects along the Kwun Tong waterfront and redevelopment zones. These developments have repositioned parts of the district from traditional industrial and office uses toward higher-quality residential neighbourhoods. Enhanced transport connectivity, including MTR access and improved pedestrian links, combined with upgraded retail and lifestyle amenities, has supported rental growth and lifted overall district valuation levels.
In the New Territories, Tuen Mun, Yuen Long and North District were the primary drivers of overall rental growth, with residential RV increasing by 6.3%, 5.9% and 5.5%, respectively. These districts benefited from relatively affordable rental levels, improving transport connectivity and steady local housing demand, which supported stronger rental adjustments during the valuation reference period. At the estate level, Metro City in Tseung Kwan O recorded a notable YoY increase in residential RV of 4.9% YoY, underpinned by strong underlying demand for student accommodation and its proximity to transport infrastructure and community facilities. The estate’s direct access to the MTR network, together with nearby educational institutions and retail amenities, continued to support stable leasing demand and rental resilience, contributing positively to overall district performance.
On Hong Kong Island, Wan Chai, the Eastern and Southern emerged as the key contributors to residential rental growth. In particular, South Horizons of the Southern district recorded robust RV growth of between 5.1% to 6.5% across different unit sizes, reflecting sustained demand for well-established, transport-connected residential estates. Within the Southern district, the introduction of new luxury residential supply in Wong Chuk Hang further lifted district-wide rental benchmarks.
Broad-Based Declines among Commercial Premises Amid Softer Leasing Demand
Across the commercial market, RV declined in all asset classes except Storage premises (+3.6%), with the steepest contractions observed in the I/O sectors (-13.4%) and office (-3.5%).Office Sector – Continued Weakness and Structural Pressure
In contrast to the residential sector, the office market continued to weaken. Although the number of office assessments increased by approximately 1.8% to over 82,000, aggregate office RV declined by 3.5% YoY.
This decline reflects soft leasing demand, persistently high vacancy rates, and a tenant-favoured market, particularly affecting lower-grade buildings. In the past couple of years, as Grade A office rents dropped significantly, narrowing to levels comparable with industrial/office (I/O) premises, I/O landlords were forced to cut rents aggressively to remain competitive.
Key office districts across Hong Kong Island and Kowloon—including Central & Western, Wan Chai, Eastern, and Kwun Tong—generally recorded RV declines. Eastern District posted the largest drop (-6.8% YoY), followed by Kwun Tong (-6.2%), highlighting continued rental pressure in non-core and decentralised office submarkets.
Other Commercial Sectors
Retail properties remained under pressure, with shop assessments increasing marginally by 1.0%, but aggregate shop RV declining by 1.6% YoY. This reflects ongoing structural challenges in the retail sector, as brands continued to close stores, reduce footprints, and downsize back-office requirements.
Industrial/Office premises recorded a sharp 13.4% YoY decline in RV, driven by the combined impact of weaker office demand and the knock-on effects of retail contraction, as occupiers reduced support space.
Factory premises saw a modest increase in assessment numbers, but aggregate factory RV still declined by 2.1%, indicating continued pressure on traditional industrial properties.
Storage premises designed or adapted for use as godowns or cold stores, remained a relative bright spot, with both assessment numbers and aggregate RV increasing by 1.5% and 3.6%, respectively. The growth in RV was mainly attributable to the Outlying Islands, where RV surged 218.3% YoY, likely due to the addition of new mega-sized storage facilities in Chek Lap Kok.